Monday, August 30, 2010

Plate boundaries lab - In Google Earth

This is hella cool and a really neat teaching resource.  Kudos Kurt!

starKurt's Weblog
August 30, 2010 12:53 PM
by Kurt

Plate boundaries lab - In Google Earth

Students will be doing the lab today to kick off Margaret's ESCI401 here at UNH. <br /><br /> <a href="http://vislab-ccom.unh.edu/~schwehr/Classes/2010/esci401/lab01/lab01.kmz">lab01.kmz</a> [9MB] or <a href="http://tinyurl.com/esci401-lab01">http://tinyurl.com/esci401-lab01</a>. <br /><br /> <img title="Plate boundaries in Google Earth" withgrayborder="True" src="http://schwehr.org/blog/attachments/2010-08/lab01.png"/> <br /><br /> Created by Kurt Schwehr and Margaret Boettcher for the ESCI 401 course at the University of New Hampshire, August 2010. Lab adapted from from <a ref="http://terra.rice.edu/plateboundary/home.html">Dale Sawyer's Discovering Plate Boundaries</a>. Sources of material: <ul> <li>Earthquakes are from the <a href="http://earthquake.usgs.gov/monitoring/anss/">ANSS</a> (Advanced National Seismic System) Catalog</li> <li>Volcanoes are from the <a href="http://www.volcano.si.edu/world/">Smithsonian Volcano</a> <a href="http://www.volcano.si.edu/world/summary.xls">Excel Workbook</a></li> <li>Topography and seafloor age images are from NOAA's NGDC: <a href="http://sos.noaa.gov/datasets/Land/sea_floor_age.html">Science on a Sphere (SOS) - Sea Floor Age</a>.</li> <li>The shore line is the <a href="http://rimmer.ngdc.noaa.gov/coast/">World Coast Line (WCL) for 1:5,000,000</a></li> <li>Plate boundaries are derived from Carlton's <a href="http://serc.carleton.edu/files/eet/seismicwave/plates_quakes_countries.zip">plates_quakes_countries.zip</a></li> </ul> <a rel="license" href="http://creativecommons.org/licenses/by-nc-sa/3.0/"><img alt="Creative Commons License" style="border-width:0" src="http://i.creativecommons.org/l/by-nc-sa/3.0/88x31.png" /></a><br /><span xmlns:dc="http://purl.org/dc/elements/1.1/" href="http://purl.org/dc/dcmitype/InteractiveResource" property="dc:title" rel="dc:type">ESCI 401 Lab 1 - A Plate Tectonics Jigsaw Puzzle - Google Earth Visualization</span> by <a xmlns:cc="http://creativecommons.org/ns#" href="http://schwehr.org/" property="cc:attributionName" rel="cc:attributionURL">Schwehr</a> and <a href="http://www.unh.edu/esci/people/boettcher-m.html">Boettcher</a> is licensed under a <a rel="license" href="http://creativecommons.org/licenses/by-nc-sa/3.0/">Creative Commons Attribution-NonCommercial-ShareAlike 3.0 Unported License</a>. <br /><br /> The very rough source code that I used to create the lab is available: <a href=" http://vislab-ccom.unh.edu/~schwehr/Classes/2010/esci401/lab01/esci401-lab01-20100830.tar.bz2">esci401-lab01-20100830.tar.bz2</a>. I used this code to generate basic files, but I did a lot of hand tuning to get the final results.


Art Trembanis
CSHEL
University of Delaware

Saturday, August 28, 2010

MIT Unveils Oil-Skimming Robot Swarm Prototype

Doesn't address the problem of subsurface oil though

starSlashdot
August 28, 2010 3:06 PM
by timothy

MIT Unveils Oil-Skimming Robot Swarm Prototype

destinyland writes "Today MIT reveals a swarm of autonomous floating robots that can digest an oil spill. The 16-foot robots drag a nanowire mesh that acts like a conveyor belt to soak up surface oil 'like paper towels soak up water,' absorbing 20 times its weight and then harmlessly 'digesting' the oil by burning it off. Powered by 21.5 square feet of solar panels, the 'Seaswarm' robots run on the power of a lightbulb, and with just 100 watts 'could potentially clean continuously for weeks' without human intervention, MIT announced. The swarm uses GPS data and communicates wirelessly to move as a coordinated group to 'corral, absorb and process' oil spills, and MIT researchers estimate that a fleet of 5,000 could clean up a gulf-sized spill within one month."

Read more of this story at Slashdot.

earth


Art Trembanis
CSHEL
University of Delaware

Friday, August 27, 2010

Maps Show How Mankind Remade Nature

starWired Top Stories
August 27, 2010 1:30 PM
by Brandon Keim

Maps Show How Mankind Remade Nature

As scientists get used to the idea that Earth is in a new geological age, that the Holocene — the last geological age — has been replaced by Anthropocene, they're figuring out how it got to be that way. Two years ago, ecologists Erle Ellis and Navin Ramankutty at the University of Maryland, Baltimore County, released a map of the world's biological areas, traditionally known as biomes. Similar maps were found on science classroom walls across the land, but theirs was different in one very fundamental way. They updated the definition of biome to reflect how human beings used the land.


Art Trembanis
CSHEL
University of Delaware

Camp introduces high school students to marine science

starUniversity of Delaware: UDaily
August 27, 2010 3:49 PM

Camp introduces high school students to marine science

Participating in the cleanup of a Baltimore marsh taught participants in TIDE Camp 2010 a memorable lesson about where human debris can end up when not disposed of properly: the fragile coastal environment.


Art Trembanis
CSHEL
University of Delaware

DIY Underwater Bubble Room

All sorts of dive safety issues here but resourceful nonetheless


starMAKE Magazine
August 27, 2010 8:00 AM
by Adam Flaherty

DIY Underwater Bubble Room

Over on BoingBoing Maggie Koerth-Baker interviews Jordan Needham about the underwater fort he and his family built at the bottom of a lake.

The dome is vinyl from the local fabric store. We switched from plastic because the plastic was kind of "cloudy" and the vinyl is optically clear. When The Bubble Room is not in use we take the net and vinyl with us and it is just a metal ring sitting on the lake bed. It takes one person about 15 minutes to attach the net and vinyl and fill it with air. All the materials except for the vinyl where free!


Inside a Nevada family's underwater fort

Read the Full Story » | More on MAKE » | Comments » | Read more articles in Toys and Games | Digg this!
Toys and Games


Art Trembanis
CSHEL
University of Delaware

Wicked Cool Slocum Electric Glider 101

starOcean Bytes
August 25, 2010 9:44 AM
by Doug White

Wicked Cool Slocum Electric Glider 101

Last week we had just received the UD-134 glider (aka the "Blue Hen") from two tours of duty in the Gulf of Mexico in collaboration with IOOS and Rutgers University for the Deepwater Horizon Oil Spill Response project.  To prepare for an upcoming Antarctic mission, we needed to get some work done on UD-134 at the source – Teledyne Webb Research in Massachusetts. Since we were only five hours south of Webb at the time, I loaded the Zune HD (with purely educational podcasts of course – in this case Security Now) and it was road-trip time for me and two of the students from the ORB lab.

The students who went with were really excited to get to learn from the masters while we tore down UD-134 at Rutgers. (For those new to gliders, Rutgers is the undisputed kings of the glider realm, they've been flying them since, like forever). One of the students who came with was a summer intern who was charged with learning how to pilot the Glider over the summer. Because of the last-minute deployment of UD-134 in the Gulf, he had lots of pilotting time on a simulator, but not so much hands-on with real Gliders. The other student was a new grad student who would be responsible for ingesting and processing glider data, so she was looking forward to the trip as well.  When we decided at the last minute to head up to Webb Research to deliver the components, the intern said he "felt like Willie Wonka with the winning ticket to tour the chocolate factory". He was definitely not disappointed as Peter Collins met us at the doors of Webb and gave the students and I the grand tour.

Peter Collins (aka "Texas Pete" for this post) donned his cowboy hard hat and headed to the ballast tank with me and a couple of our students last week to do a quick talk for Ocean Bytes.  Pete gave a quick introduction to the Slocum Electric Glider - an Autonomous Underwater Vehicle (AUV) or Underwater Glider that is made by Teledyne Webb Research. Take note that the glider that Pete has in front of him as it is a tad different from most in that it has two science bays (there is usually only one). This one is being fitted with a Photosynthetically Active Radiation (PAR) sensor and a FIRe sensor  (remember Lauren's video?) from Satlantic. I'll hand you to Peter now so he can discuss what a glider is for and how it works…

In addition to the lineup of first generation gliders, we were introduced to the second generation gliders that are just now being manufactured – also called the "G2″ gliders.  I'll try to cover everything that we learned about the G2 systems in a future post.

Thanks again Peter for the awesome hospitality and for taking such great care of us!

AUV/ROV AUV electric glider FIRe PAR slocum Webb Research


Art Trembanis
CSHEL
University of Delaware

Wednesday, August 25, 2010

BP not sharing AIS with NAIS and ERMA

starKurt's Weblog
August 25, 2010 9:30 AM
by Kurt

BP not sharing AIS with NAIS and ERMA

This is a case where I must set the record straight now that <a href="http://www.portvision.com/">PortVision</a> has issued a <a href="http://www.marinelink.com/news/vesseltracking-portvision335326.aspx">press release</a>. I fully understand that it will likely be a long time before the response effort is completed. <br /><br /> For the Deepwater Horizon incident in the Gulf of Mexico, the primary situational awareness tool for responders and the public was provided by the <a href="http://www.crrc.unh.edu/erma/index.html">Environmental Response Management Application (ERMA)</a>. I wrote the AIS software that drove ERMA and used the USCG's NAIS data feed to it. I can say definitely that NAIS received NO data from BP or PortVision. I talked to BP and requested that they at least send the output from one or more of their receivers out at the well area to the USCG NAIS system. The process of sending data to the USCG is really easy and I offered to give BP the contact information of the people at the USCG that could make this happen. BP said, "NO. We already are showing the data on a single computer display that the Coast Guard can view." So the AIS data collected by BP and PortVision were in no way distributed to the rest of the response teams through ERMA. There is a fiber ring out on the seafloor in the Gulf of Mexico getting the data back to the shore, but it did not make it to ERMA. <br /><br /> The person at BP complained that he could not give me the data and did not know who I was. I reminded him that I was requesting that he give the data to the USCG through the official USCG NAIS system, not to me. However, he seemed unable to acknowledge that I was not requesting the data come through me. I then tried to explain that the USCG would then distribute the data back to me through normal approved channels. I do not know why this was difficult for BP. <br /><br /> Although PortVision may have provided excellent support to BP throughout the crisis, unfortunately, due to BP, none of the AIS data made it to the ERMA interface for the responders in the Gulf. <pre> "We have worked closely with BP and the Unified Command operations team in support of real-time vessel-tracking activities related to the Gulf incident response and restoration effort," said Dean Rosenberg, chief executive officer.</pre> I hope that oil and gas companies will work more in the future with the USCG to get AIS feeds from platforms and remote installations to the USCG NAIS system before incidents occur and make a plan to have satellite or cellular data up links to NAIS setup on the fly for incidents that happen away from fixed infrastructure. If you are a first responder or oil & gas company and want to work with the USCG to make this happen, I can put you in touch with the right people at the USCG (and give you a couple setup tips). It's not that hard to setup. <br /><br /> On a positive note, the ERMA team worked with <a href="http://www.findmespot.com">FindMeSpot</a> to track a number of response teams. FindMeSpot worked much better in the Gulf of Mexico than my experiences with it in New England. <br /><br /> The full press release: <a href="http://www.marinelink.com/news/vesseltracking-portvision335326.aspx">PortVision Vessel-Tracking for Gulf Cleanup Ops</a> <pre>PortVision, provider of business intelligence solutions for the maritime industry, announced that BP has used the company's PortVision vessel-tracking service and PV-OnBoard battery-operated satellite trackers to enhance and accelerate response and restoration operations related to the April 20, 2010, Deepwater Horizon incident. <!-- --> "The PortVision service has significantly improved how we have managed vessel activity related to the Gulf response and restoration operation," said Scott Neuhauser, Deputy Branch Director for Plaquemines Parish with BP. "PortVision has given us significantly greater visibility into what's occurring in the field so that we could assess progress and more effectively allocate the more than 30,800 personnel, 5,050 vessels and dozens of aircraft that are engaged in the response effort." <!-- --> "We have worked closely with BP and the Unified Command operations team in support of real-time vessel-tracking activities related to the Gulf incident response and restoration effort," said Dean Rosenberg, chief executive officer. "This includes providing a combination of hardware and customized software, extensive support services, and our PV-OnBoard satellite trackers. The PortVision service offers significant benefits in incident-response and other maritime intelligence applications, and also enables responders and other parties to access historical AIS and satellite data for a variety of purposes, from policy development and training to litigation support and the verification of vessel operating fees and service charges." <!-- --> The PortVision service leverages the world's only comprehensive database of AIS real-time and historical tracking data to provide detailed visibility into commercial vessel activity, from port arrivals and departures to ship movements on the open sea. To track smaller vessels that are not equipped with AIS transponders, BP and the Unified Command team have used the PortVision service with data provided by the company's PV-OnBoard battery-operated satellite trackers, which are now being deployed on the Louisiana Gulf Coast. Information from the combination of AIS and satellite data has simplified the team's challenging task of monitoring and managing the many ships, fishing boats, skimmers and barges that have been operated by multiple organizations in adjacent and often overlapping response areas. <!-- --> Additionally, PortVision has customized its offering for BP and the Unified Command team, adding screen overlays of divisional response areas throughout the affected Gulf regions, and color-coding vessel types within these areas using the PortVision VesselZones feature. The ability to create user-defined VesselZones simpifies vessel viewing, tracking and alerts while streamlining and enhancing incident response.</pre>


Art Trembanis
CSHEL
University of Delaware

Tuesday, August 24, 2010

Scientific visualization

Scientific visualization

Sent via Wikipanion


Art Trembanis
CSHEL
University of Delaware

Visual World: Best of Infographics, Data Visualization (New Anti-Social)

Check out this video on YouTube:

http://www.youtube.com/watch?v=eMrOFuSZAj4&feature=youtube_gdata_player


Art Trembanis
CSHEL
University of Delaware
www.geology.udel.edu/cshel
Oil-Gobbling Bug Raises Gulf Hopes ... for Now

starWired Top Stories
August 24, 2010 4:06 PM
by Brandon Keim

Oil-Gobbling Bug Raises Gulf Hopes ... for Now

A week after a high-profile paper suggested that the vast Deepwater Horizon oil plume could linger for months, another study claims bacteria are breaking the oil down quickly, and that the plume is likely gone. The conflict between the results are striking. Other researchers warn that there's just too little data to draw any conclusions. But the new findings are at least encouraging.


Art Trembanis
CSHEL
University of Delaware

Important Basics for Google Earth

From Google Earth
http://feedproxy.google.com/~r/GoogleEarthBlog/~3/fbnj-qWtpBo/important_basics_for.html


Art Trembanis
CSHEL
University of Delaware
www.geology.udel.edu/cshel
More imagery from Pakistan flooding

From Google Earth
http://feedproxy.google.com/~r/GoogleEarthBlog/~3/WWAZXN7OEPk/more_imagery_from_pakistan_flooding.html


Art Trembanis
CSHEL
University of Delaware
www.geology.udel.edu/cshel

Gulf Oil Spill: Defenders of Wildlife

From Google Earth
http://feedproxy.google.com/~r/GoogleEarthBlog/~3/mMrYDLmkbGA/gulf_oil_spill_defenders_of_wildlif.html


Art Trembanis
CSHEL
University of Delaware
www.geology.udel.edu/cshel

Can Useful Intelligence Be Extracted From Visualizations?

http://www.vector1media.com/dialogue/perspectives/14945-can-useful-intelligence-be-extracted-from-visualizations

Turning Satellite Data into Google Earth Maps: It’s Easy!

starOcean Bytes
August 20, 2010 3:08 PM
by Megan Cimino

Turning Satellite Data into Google Earth Maps: It's Easy!

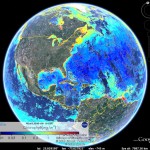
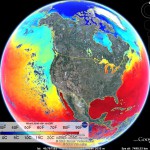
World Chlorophyll Concentrations World Sea Surface Temperature

As a new grad student in the ORB (Ocean exploration, Remote Sensing, and Biogeography) lab at the University of Delaware under Dr. Matthew Oliver, I (along with my cohort Danielle Haulsee) were tasked with learning to write code in R.  R is a language that enables statistical computing and making graphical displays. To some of you this may sound basic, but having no prior programming experience it was a little overwhelming at times.  After getting the basics down, we then started pulling sea surface temperature and chlorophyll data from NASA's Goddard Space Flight Center (GSFC) MODIS Aqua satellite.  This isn't just any temperature and chlorophyll data either, it's real-time and updated everyday!  From this we were able to create maps on Google Earth, which is a great platform for viewing and interacting with multiple data layers on a global scale.  This allows us to easily distribute NASA's data for ocean planning.  These overlays along with others were also able to assist in planning Slocum Glider missions in areas surrounding the Gulf oil spill.

In our Google Earth maps, we created 1, 3, and 8 day averages that reflect the current conditions in the ocean.  Each day our code downloads the lastest satellite data that has been updated on NASA's website and then it is averaged along with the previous days to create an average. The 1 day average maps are patchy due to the fact that the satellites can not see through the clouds.  Therefore, the 8 day averages make for a more complete and accurate picture.  For higher resolution images, we created smaller maps of just California, the East Coast and even Antarctica!  These locations correspond to areas that we conduct further research in.   Google Earth was interested in our overlays so check out the Google Earth Gallery for sea surface temperature and chlorophyll concentrations near you!

Satellite Google Earth NASA satellite


Art Trembanis
CSHEL
University of Delaware

Thursday, August 19, 2010

Boat race replays in Google Earth

From Google Earth
http://feedproxy.google.com/~r/GoogleEarthBlog/~3/1inJWcaNIJQ/boat_race_replays_in_google_earth.html


Art Trembanis
CSHEL
University of Delaware
www.geology.udel.edu/cshel

Lost Knowledge: Knot tying

starMAKE Magazine
August 19, 2010 7:00 PM
by Gareth Branwyn

Lost Knowledge: Knot tying

The Lost Knowledge column explores the possible technologies of the future in the forgotten ideas of the past (and those slightly forgotten or just off to the side). We look at retro-tech, "lost" technology, and the make-do, improvised "street tech" of village artisans and tradespeople from around the globe. "Lost Knowledge" was also the theme of MAKE Volume 17


One of my favorite sites for finding ideas for the "Lost Knowledge" column, Low-Tech Magazine, has a piece (first in a series?) called "Lost Knowledge: ropes and knots." Hey, why not? We've been... "borrowing" from them... In fact, I'd been planning on doing a column on knot tying, and again, they've done most of the work for me! They actually have two fairly in-depth features, the "Ropes and knots" piece and "How to tie the world together: online knotting reference books." Here are some excerpts from these pieces, followed by some additional resources, and previous knotty content from MAKE.

ropeLostKnowledge_1.jpg

From "Lost Knowledge: Ropes and knots:"

Few realize the importance that knots and cords have played in human history. It is remarkable that they are not even mentioned in otherwise great books on the history of technology. Yet, it is hard to find any important technology developed over the last 250,000 years that did not, in some way, make use of ropes and knots. Starting in prehistoric times, they were used for hunting, pulling, fastening, attaching, carrying, lifting and climbing.
The hardware: ropes


From fibers to rope In rope making, four basic steps are identified: preparing the fibre, spinning the fibres together to form yarns, twisting the yarns in bunches to form strands, and winding the strands in rope.

At each stage the twisting is performed in the opposite direction from the previous stage, in order to overcome the natural tendency for each yarn, strand or rope to unravel. Most ropes consist of three twisted strands (called a Hawser laid rope).

Read the Full Story » | More on MAKE » | Comments » | Read more articles in Retro | Digg this!
Retro


Art Trembanis
CSHEL
University of Delaware

Saturday, August 7, 2010

The Decade Volcanoes

From Google Earth
http://feedproxy.google.com/~r/GoogleEarthBlog/~3/tGE1QRDh87c/the_decade_volcanoes.html


Art Trembanis
CSHEL
University of Delaware
www.geology.udel.edu/cshel

100-Sq.-Mile Ice Island Breaks Off Greenland Glacier

starSlashdot
August 7, 2010 6:11 PM
by kdawson

100-Sq.-Mile Ice Island Breaks Off Greenland Glacier

suraj.sun sends word of a 100-sq.-mile (260-sq.-km) ice island that broke off of a Greenland glacier on Thursday. "The block of ice separated from the Petermann Glacier, on the north-west coast of Greenland. It is the largest Arctic iceberg to calve since 1962... The ice could become frozen in place over winter or escape into the waters between Greenland and Canada. ... [NASA satellite] images showed that Petermann Glacier lost about one-quarter of its 70-km-long (43-mile) floating ice shelf. There was enough fresh water locked up in the ice island to 'keep all US public tap water flowing for 120 days,' said Prof Muenchow." The Montreal Gazette has more details and implications for Canadian shipping and oil exploration, along with this telling detail: "the ice island's thickness [is] more than 200 metres in some places... [or] half the height of the Empire State Building." The NY Times has a good satellite photo of the situation.

Read more of this story at Slashdot.

earth


Art Trembanis
CSHEL
University of Delaware