September 5, 2011 7:50 PM
by Kurt
Python development - Hurricane Irene
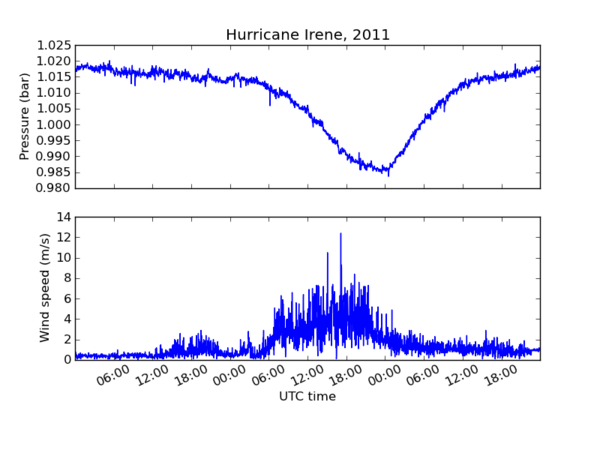
Today I gave a run through of a portion of what I aim to teach this semester in research tools. I wanted to make a demonstration of going from a sensor in the world, creating a parser for the data it produces, plotting up some results and releasing the code to the world. I'm using the CCOM weather station as an example. Andy and Ben got the Airmar PB150 setup quite a while ago. It spits out NMEA over a serial port at 4800 baud. I use my serial-logger script to read the serial port and rebroadcast the data over the internal network for anyone who is interested. Here is using <a href="http://freshmeat.net/projects/socat/">socat</a> to grab a few lines of the data: <pre><b>socat TCP4:datalogger1:36000 - | head</b> $HCHDT,26.2,T*1F,rccom-airmar,1314661980.3 $GPVTG,275.1,T,290.5,M,0.1,N,0.1,K,D*29,rccom-airmar,1314661980.38 $GPZDA,235300,29,08,2011,00,00*4E,rccom-airmar,1314661980.45 $WIMWV,143.9,R,1.9,N,A*24,rccom-airmar,1314661980.52 $GPGGA,235300,4308.1252,N,07056.3764,W,2,9,0.9,37.2,M,,,,*08,rccom-airmar,1314661980.64 $WIMDA,30.0497,I,1.0176,B,17.8,C,,,,,,,167.2,T,182.6,M,1.9,N,1.0,M*2A,rccom-airmar,1314661980.79 $HCHDT,26.2,T*1F,rccom-airmar,1314661980.82 $WIMWD,167.2,T,182.6,M,1.9,N,1.0,M*5C,rccom-airmar,1314661980.9 $WIMWV,141.0,T,1.9,N,A*29,rccom-airmar,1314661980.97 $WIMWV,144.5,R,1.9,N,A*2F,rccom-airmar,1314661981.02</pre> The ",rccom-airmar,1314661980.97" is added by my serial-logger giving each line a station name and a UNIX UTC timestamp. Eric Raymond (ESR) has put together a very nice document on NMEA sentences: <a href="http://gpsd.berlios.de/NMEA.html">NMEA Revealed</a>. It describes many of the scentences in common use. What do we have for contents? The unix "cut" command can pull out the "talker" + "sentence" part of each line. The -d specifies that the sort with "-u" for collapsing the output to the unique list of lines can get the job done. <pre><b>egrep -v '^[#]' ccom-airmar-2011-08-28 | cut -d, -f1 | sort -u</b> $GPGGA $GPVTG $GPZDA $HCHDT $PNTZNT $WIMDA $WIMWD $WIMWV</pre> All of those messages (except my custom PNTZNT message for NTP clock status) are documented in ESR's NMEA Revealed. <br /><br /> To look at the weather from Hurricane Irene, we want to look at the MDA is listed as "Obsolete" by ESR according to a NMEA 2009 doc, but that is the message we want to use. In python we could parse this by hand. Here is an example "Meteorological Composite" NMEA line: <pre>$WIMDA,30.0497,I,1.0176,B,17.8,C,,,,,,,167.2,T,182.6,M,1.9,N,1.0,M*2A</pre> Python makes it easy to do splits on strings and use any separator that we line. For example, we could do: <pre>fields = line.split(',')</pre> This would break apart each of the blocks. However, this doesn't scale well and does not tell us when a message is too corrupted to be usable data. I have written a large number of <a href="http://en.wikipedia.org/wiki/Regular_expression">regular expressions</a> in Python for NMEA sentences based on emails that I get from the USCG Healy. <br /><br /> I wanted to start turning those into a library that I could make usable by anyone. I created the nmea decoder package. I used mercurial (hg) for version control and uploaded it to bitbucket as <a href="https://bitbucket.org/schwehr/nmeadec"> (nmeadec)</a>. It's pure python and simpler (but less powerful) than gpsd. I really like the way that python's regular expression syntax lets you name the fields and retrieve a named dictionary when messages are decoded. You can find the regular expression for MDA here: <a href="https://bitbucket.org/schwehr/nmeadec/src/1a7dd4cfa55b/nmeadec/raw.py#cl-39">nmeadec/raw.py - line 39</a>. With nmeadec 0.1 written, I can now parse NMEA in Python like this: <pre>msg = nmeadec.decode(line)</pre> The <a href="http://pypi.python.org/pypi/PasteScript">PasteScript</a> package gave a helping hand for creating a basic python package. I did this from inside of a virtualenv to protect the system and fink python space. <pre><b>virtualenv ve cd ve source bin/activate mkdir src paster create nmeadec</b></pre> I answered a whole bunch of questions and it setup a simple package using setuptools/distribute. <br /><br /> Since you are not creating that package and might want to follow along, you can grab the package in src (and skip running the paster command to create a new project. <pre><b>hg clone https://schwehr@bitbucket.org/schwehr/nmeadec</b></pre> Because I set this up in a terminal using a virtualenv being active, then I can use this command to setup the package for development without funny python PATH hacks: <pre><b>cd nmeadec python setup.py develop</b></pre> Now, we need to pull out the data. I created a little module called "process_wx.py". It let's you down sample the data there were more than 86,000 MDA messages in a day. <pre><tt><b><font color="#000080">from</font></b> __future__ <b><font color="#000080">import</font></b> print_function <b><font color="#000080">import</font></b> nmeadec <!-- --> <b><font color="#0000FF">def</font></b> <b><font color="#000000">get_wx</font></b><font color="#990000">(</font>filename<font color="#990000">,</font> nth<font color="#990000">=</font>None<font color="#990000">):</font> pres <font color="#990000">=</font> <font color="#990000">[]</font> speed <font color="#990000">=</font> <font color="#990000">[]</font> timestamps <font color="#990000">=</font> <font color="#990000">[]</font> mda_count <font color="#990000">=</font> <font color="#993399">0</font> <i><font color="#9A1900"># for handling the nth MDA entry</font></i> <!-- --> <b><font color="#0000FF">for</font></b> line <b><font color="#0000FF">in</font></b> <b><font color="#000000">file</font></b><font color="#990000">(</font>filename<font color="#990000">):</font> <b><font color="#0000FF">try</font></b><font color="#990000">:</font> msg <font color="#990000">=</font> nmeadec<font color="#990000">.</font><b><font color="#000000">decode</font></b><font color="#990000">(</font>line<font color="#990000">)</font> <b><font color="#0000FF">except</font></b><font color="#990000">:</font> <b><font color="#0000FF">continue</font></b> <!-- --> <b><font color="#0000FF">try</font></b><font color="#990000">:</font> <b><font color="#0000FF">if</font></b> msg<font color="#990000">[</font><font color="#FF0000">'sentence'</font><font color="#990000">]</font> <font color="#990000">!=</font> <font color="#FF0000">'MDA'</font><font color="#990000">:</font> <b><font color="#0000FF">continue</font></b> <b><font color="#0000FF">except</font></b><font color="#990000">:</font> <b><font color="#0000FF">print</font></b> <font color="#990000">(</font><font color="#FF0000">'trouble:'</font><font color="#990000">,</font>line<font color="#990000">,</font>msg<font color="#990000">)</font> <!-- --> mda_count <font color="#990000">+=</font> <font color="#993399">1</font> <b><font color="#0000FF">if</font></b> nth <b><font color="#0000FF">is</font></b> <b><font color="#0000FF">not</font></b> None <b><font color="#0000FF">and</font></b> mda_count <font color="#990000">%</font> nth <font color="#990000">!=</font> <font color="#993399">1</font><font color="#990000">:</font> <b><font color="#0000FF">continue</font></b> <i><font color="#9A1900"># skip all but the nth. start with first</font></i> <!-- --> <i><font color="#9A1900">#print (msg['pressure_bars'], msg['wind_speed_ms'])</font></i> pres<font color="#990000">.</font><b><font color="#000000">append</font></b><font color="#990000">(</font>msg<font color="#990000">[</font><font color="#FF0000">'pressure_bars'</font><font color="#990000">])</font> speed<font color="#990000">.</font><b><font color="#000000">append</font></b><font color="#990000">(</font>msg<font color="#990000">[</font><font color="#FF0000">'wind_speed_ms'</font><font color="#990000">])</font> timestamps<font color="#990000">.</font><b><font color="#000000">append</font></b><font color="#990000">(</font><b><font color="#000000">float</font></b><font color="#990000">(</font>line<font color="#990000">.</font><b><font color="#000000">split</font></b><font color="#990000">(</font><font color="#FF0000">','</font><font color="#990000">)[-</font><font color="#993399">1</font><font color="#990000">]))</font> <!-- --> <b><font color="#0000FF">return</font></b> <font color="#990000">{</font><font color="#FF0000">'pres'</font><font color="#990000">:</font>pres<font color="#990000">,</font> <font color="#FF0000">'speed'</font><font color="#990000">:</font>speed<font color="#990000">,</font> <font color="#FF0000">'timestamps'</font><font color="#990000">:</font>timestamps<font color="#990000">}</font></tt></pre> We can then use that in ipython to see how it works: <pre><b>ipython -pylab</b> # Ask for ipython to preload lots <b>import process_wx data = process_wx.get_wx('ccom-airmar-2011-08-28') data.keys()</b> ['timestamps', 'speed', 'pres'] <b>len(data['timestamps'])</b> 86361 <b>data = process_wx.get_wx('ccom-airmar-2011-08-28', nth=10) len(data['timestamps'])</b> 8637</pre> Now to load 3 days: <pre><tt><b><font color="#000080">import</font></b> process_wx <b><font color="#000080">from</font></b> numpy <b><font color="#000080">import</font></b> array <!-- --> <i><font color="#9A1900"># explicit:</font></i> days <font color="#990000">=</font> <font color="#990000">[]</font> days<font color="#990000">.</font><b><font color="#000000">append</font></b><font color="#990000">(</font> process_wx<font color="#990000">.</font><b><font color="#000000">get_wx</font></b><font color="#990000">(</font><font color="#FF0000">'ccom-airmar-2011-08-27'</font><font color="#990000">,</font> nth<font color="#990000">=</font><font color="#993399">10</font><font color="#990000">)</font> <font color="#990000">)</font> days<font color="#990000">.</font><b><font color="#000000">append</font></b><font color="#990000">(</font> process_wx<font color="#990000">.</font><b><font color="#000000">get_wx</font></b><font color="#990000">(</font><font color="#FF0000">'ccom-airmar-2011-08-28'</font><font color="#990000">,</font> nth<font color="#990000">=</font><font color="#993399">10</font><font color="#990000">)</font> <font color="#990000">)</font> days<font color="#990000">.</font><b><font color="#000000">append</font></b><font color="#990000">(</font> process_wx<font color="#990000">.</font><b><font color="#000000">get_wx</font></b><font color="#990000">(</font><font color="#FF0000">'ccom-airmar-2011-08-29'</font><font color="#990000">,</font> nth<font color="#990000">=</font><font color="#993399">10</font><font color="#990000">)</font> <font color="#990000">)</font> <!-- --> <i><font color="#9A1900"># Does the same as the above, but in one line with "list comprehensions"</font></i> days <font color="#990000">=</font> <font color="#990000">[</font> process_wx<font color="#990000">.</font><b><font color="#000000">get_wx</font></b><font color="#990000">(</font><font color="#FF0000">'ccom-airmar-2011-08-'</font><font color="#990000">+</font><b><font color="#000000">str</font></b><font color="#990000">(</font>day<font color="#990000">),</font> nth<font color="#990000">=</font><font color="#993399">10</font><font color="#990000">)</font> <b><font color="#0000FF">for</font></b> day <b><font color="#0000FF">in</font></b> <font color="#990000">(</font><font color="#993399">27</font><font color="#990000">,</font> <font color="#993399">28</font><font color="#990000">,</font> <font color="#993399">29</font><font color="#990000">)</font> <font color="#990000">]</font> <!-- --> <i><font color="#9A1900"># We then have to get the pressure, temperature, and timestamps for the 3 days and combine them</font></i> <i><font color="#9A1900"># This is pulling out a few too many tricks in one line!</font></i> pres <font color="#990000">=</font> <b><font color="#000000">array</font></b> <font color="#990000">(</font> <b><font color="#000000">sum</font></b><font color="#990000">(</font> <font color="#990000">[</font> day<font color="#990000">[</font><font color="#FF0000">'pres'</font><font color="#990000">]</font> <b><font color="#0000FF">for</font></b> day <b><font color="#0000FF">in</font></b> days <font color="#990000">],</font> <font color="#990000">[</font> <font color="#990000">]</font> <font color="#990000">)</font> <font color="#990000">)</font> speed <font color="#990000">=</font> <b><font color="#000000">array</font></b> <font color="#990000">(</font> <b><font color="#000000">sum</font></b><font color="#990000">(</font> <font color="#990000">[</font> day<font color="#990000">[</font><font color="#FF0000">'speed'</font><font color="#990000">]</font> <b><font color="#0000FF">for</font></b> day <b><font color="#0000FF">in</font></b> days <font color="#990000">],</font> <font color="#990000">[</font> <font color="#990000">]</font> <font color="#990000">)</font> <font color="#990000">)</font> timestamps <font color="#990000">=</font> <b><font color="#000000">array</font></b> <font color="#990000">(</font> <b><font color="#000000">sum</font></b><font color="#990000">(</font> <font color="#990000">[</font> day<font color="#990000">[</font><font color="#FF0000">'timestamps'</font><font color="#990000">]</font> <b><font color="#0000FF">for</font></b> day <b><font color="#0000FF">in</font></b> days <font color="#990000">],</font> <font color="#990000">[</font> <font color="#990000">]</font> <font color="#990000">)</font> <font color="#990000">)</font></tt></pre> We now have the data loaded and it's time to take a look at it! <pre><b>min(data['speed']),max(data['speed'])</b> (0.0, 12.4) <b>min(data['pres']),max(data['pres'])</b> (0.98370000000000002, 1.0201) <b>average(data['speed'])</b> 1.52199 <b>average(data['pres'])</b> 1.0084 <b>median(data['speed'])</b> 1.0 <b>median(data['pres'])</b> 1.013650</pre> And finally, we would like to make a plot of these parameters. There are several plotting packages for python. Probably the most flexible and powerful is <a href="http://matplotlib.sourceforge.net/">matplotlib</a>. It is very similar to plotting in matlab. <pre><tt><i><font color="#9A1900"># Top plot</font></i> <b><font color="#000000">subplot</font></b><font color="#990000">(</font><font color="#993399">211</font><font color="#990000">)</font> <b><font color="#000000">ylabel</font></b><font color="#990000">(</font><font color="#FF0000">'Pressure (bar)'</font><font color="#990000">)</font> <b><font color="#000000">xlabel</font></b><font color="#990000">(</font><font color="#FF0000">''</font><font color="#990000">)</font> <!-- --> <i><font color="#9A1900"># Turn off labels for the xaxis</font></i> ax<font color="#990000">=</font><b><font color="#000000">gca</font></b><font color="#990000">()</font> ax<font color="#990000">.</font><b><font color="#000000">xaxis_date</font></b><font color="#990000">()</font> old_xfmt <font color="#990000">=</font> ax<font color="#990000">.</font>xaxis<font color="#990000">.</font><b><font color="#000000">get_major_formatter</font></b><font color="#990000">()</font> xfmt<font color="#990000">=</font><b><font color="#000000">DateFormatter</font></b><font color="#990000">(</font><font color="#FF0000">''</font><font color="#990000">)</font> ax<font color="#990000">.</font>xaxis<font color="#990000">.</font><b><font color="#000000">set_major_formatter</font></b><font color="#990000">(</font>xfmt<font color="#990000">)</font> <!-- --> <b><font color="#000000">title</font></b><font color="#990000">(</font><font color="#FF0000">'Hurricane Irene, 2011'</font><font color="#990000">)</font> <b><font color="#000000">plot</font></b> <font color="#990000">(</font>data<font color="#990000">[</font><font color="#FF0000">'dates'</font><font color="#990000">],</font>data<font color="#990000">[</font><font color="#FF0000">'pres'</font><font color="#990000">])</font> <!-- --> <i><font color="#9A1900"># Bottom plot</font></i> <b><font color="#000000">subplot</font></b><font color="#990000">(</font><font color="#993399">212</font><font color="#990000">)</font> <b><font color="#000000">xlabel</font></b><font color="#990000">(</font><font color="#FF0000">'UTC time'</font><font color="#990000">)</font> <b><font color="#000000">ylabel</font></b><font color="#990000">(</font><font color="#FF0000">'Wind speed (m/s)'</font><font color="#990000">)</font> <!-- --> <i><font color="#9A1900"># Label x-axis by Hour:Minute</font></i> <b><font color="#000000">xticks</font></b><font color="#990000">(</font> rotation<font color="#990000">=</font><font color="#993399">25</font> <font color="#990000">)</font> <b><font color="#000000">subplots_adjust</font></b><font color="#990000">(</font>bottom<font color="#990000">=</font><font color="#993399">0.2</font><font color="#990000">)</font> ax<font color="#990000">=</font><b><font color="#000000">gca</font></b><font color="#990000">()</font> ax<font color="#990000">.</font><b><font color="#000000">xaxis_date</font></b><font color="#990000">()</font> xfmt<font color="#990000">=</font><b><font color="#000000">DateFormatter</font></b><font color="#990000">(</font><font color="#FF0000">'%H:%M'</font><font color="#990000">)</font> ax<font color="#990000">.</font>xaxis<font color="#990000">.</font><b><font color="#000000">set_major_formatter</font></b><font color="#990000">(</font>xfmt<font color="#990000">)</font> <!-- --> <i><font color="#9A1900"># 30.6 (meters / second) = 68.5 mph</font></i> <b><font color="#000000">plot</font></b> <font color="#990000">(</font>data<font color="#990000">[</font><font color="#FF0000">'dates'</font><font color="#990000">],</font>data<font color="#990000">[</font><font color="#FF0000">'speed'</font><font color="#990000">])</font> <b><font color="#000000">title</font></b><font color="#990000">(</font><font color="#FF0000">''</font><font color="#990000">)</font></tt></pre> I used <a href="http://www.graphicsmagick.org/">GraphicsMagick</a> (fork of ImageMagick) to resize the image to have a width of 600 pixels. Yes, I could have set the output size in matplotlib. <pre><b>convert -resize 600 ~/Desktop/raw-fig.png final-figure.png</b></pre> <img width="600" height="450" title="Time series of Irene at CCOM" withgrayborder="True" src="http://schwehr.org/blog/attachments/2011-09/nh-durham-airmar-ccom-hurricane-irene.png"/>
Dr. Art Trembanis
Associate Professor
CSHEL
109 Penny Hall
Department of Geological Sciences
The College of Earth, Ocean, and Environment
University of Delaware
Newark DE 19716
302-831-2498
"Education is not the filling of a pot, but the lighting of a fire." -W. B. Yeats
No comments:
Post a Comment